ChatWMS Dashboards

Turn Your Questions Into
Operational Visibility 

Monitor what matters without waiting on reports.

Screenshot 2026-09-11 083022

 Your Operation Shouldn’t Wait Weeks for Better Visibility

Operations knows what it needs to see. Building it should not take weeks.

DASHBOARDS TAKE TOO LONG TO BUILD

Simple requests can sit in analyst or IT queues for days.

OPERATIONS DEPENDS ON OTHER TEAMS

Small changes often mean another request.

DATA LIVES IN TOO MANY PLACES

Teams piece together screens, reports, exports, and spreadsheets.

THE OPERATION MOVES FASTER THAN THE REPORTING

By the time the view is ready, priorities may have changed.

 Build the visibility you need. Without the wait.  

Ask for the data. Build the view. Keep it in sight.

 1. Ask 

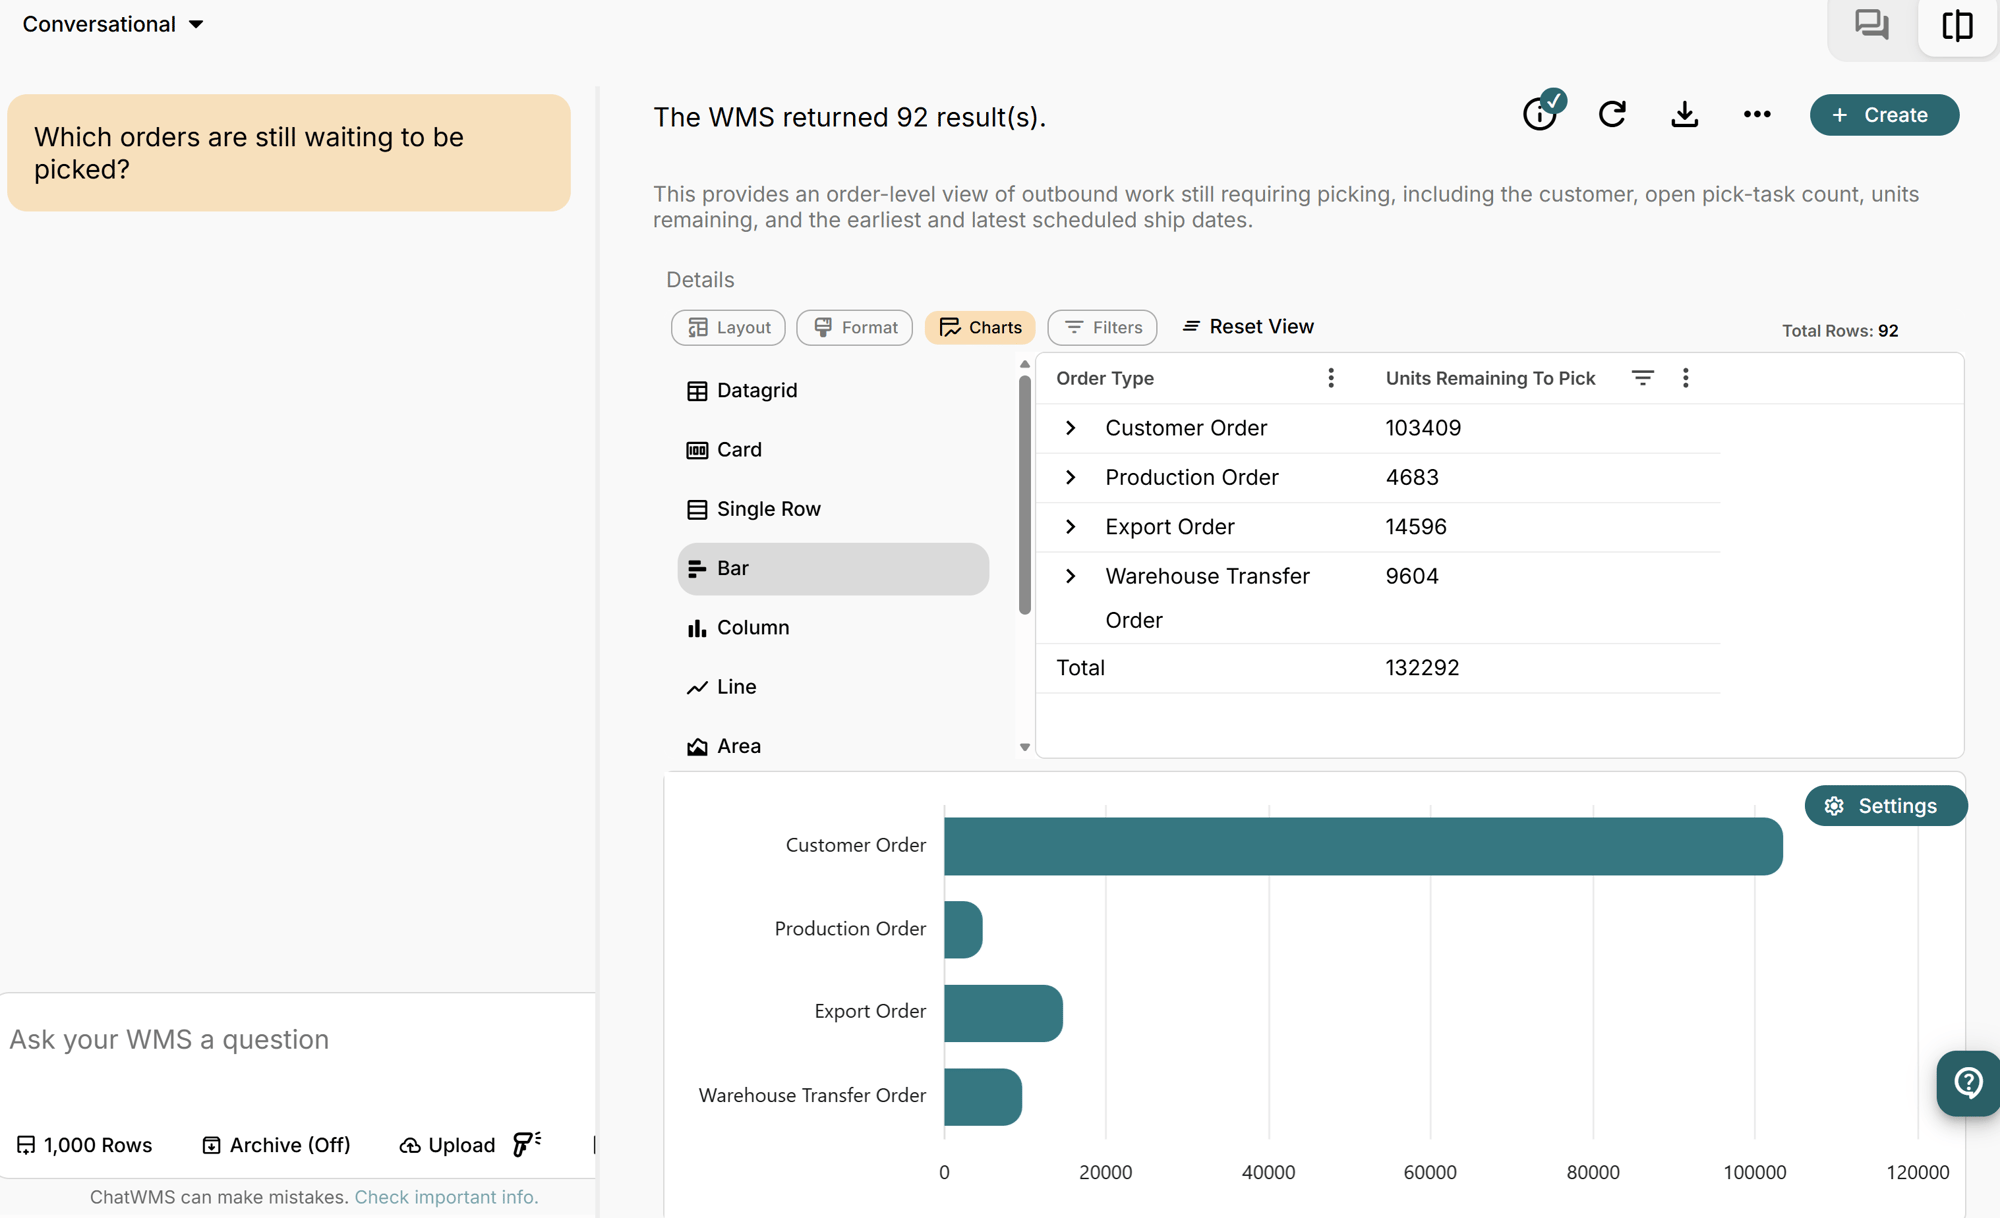
Ask a warehouse question in plain language.

 2. Build

Turn the result into charts, metrics, and tables.

 3.  Monitor 

Add it to a dashboard and keep the operation in view.

Screenshot 2026-09-10 161743

Built for the way warehouse teams actually monitor performance. 

Screenshot 2026-09-11 095724

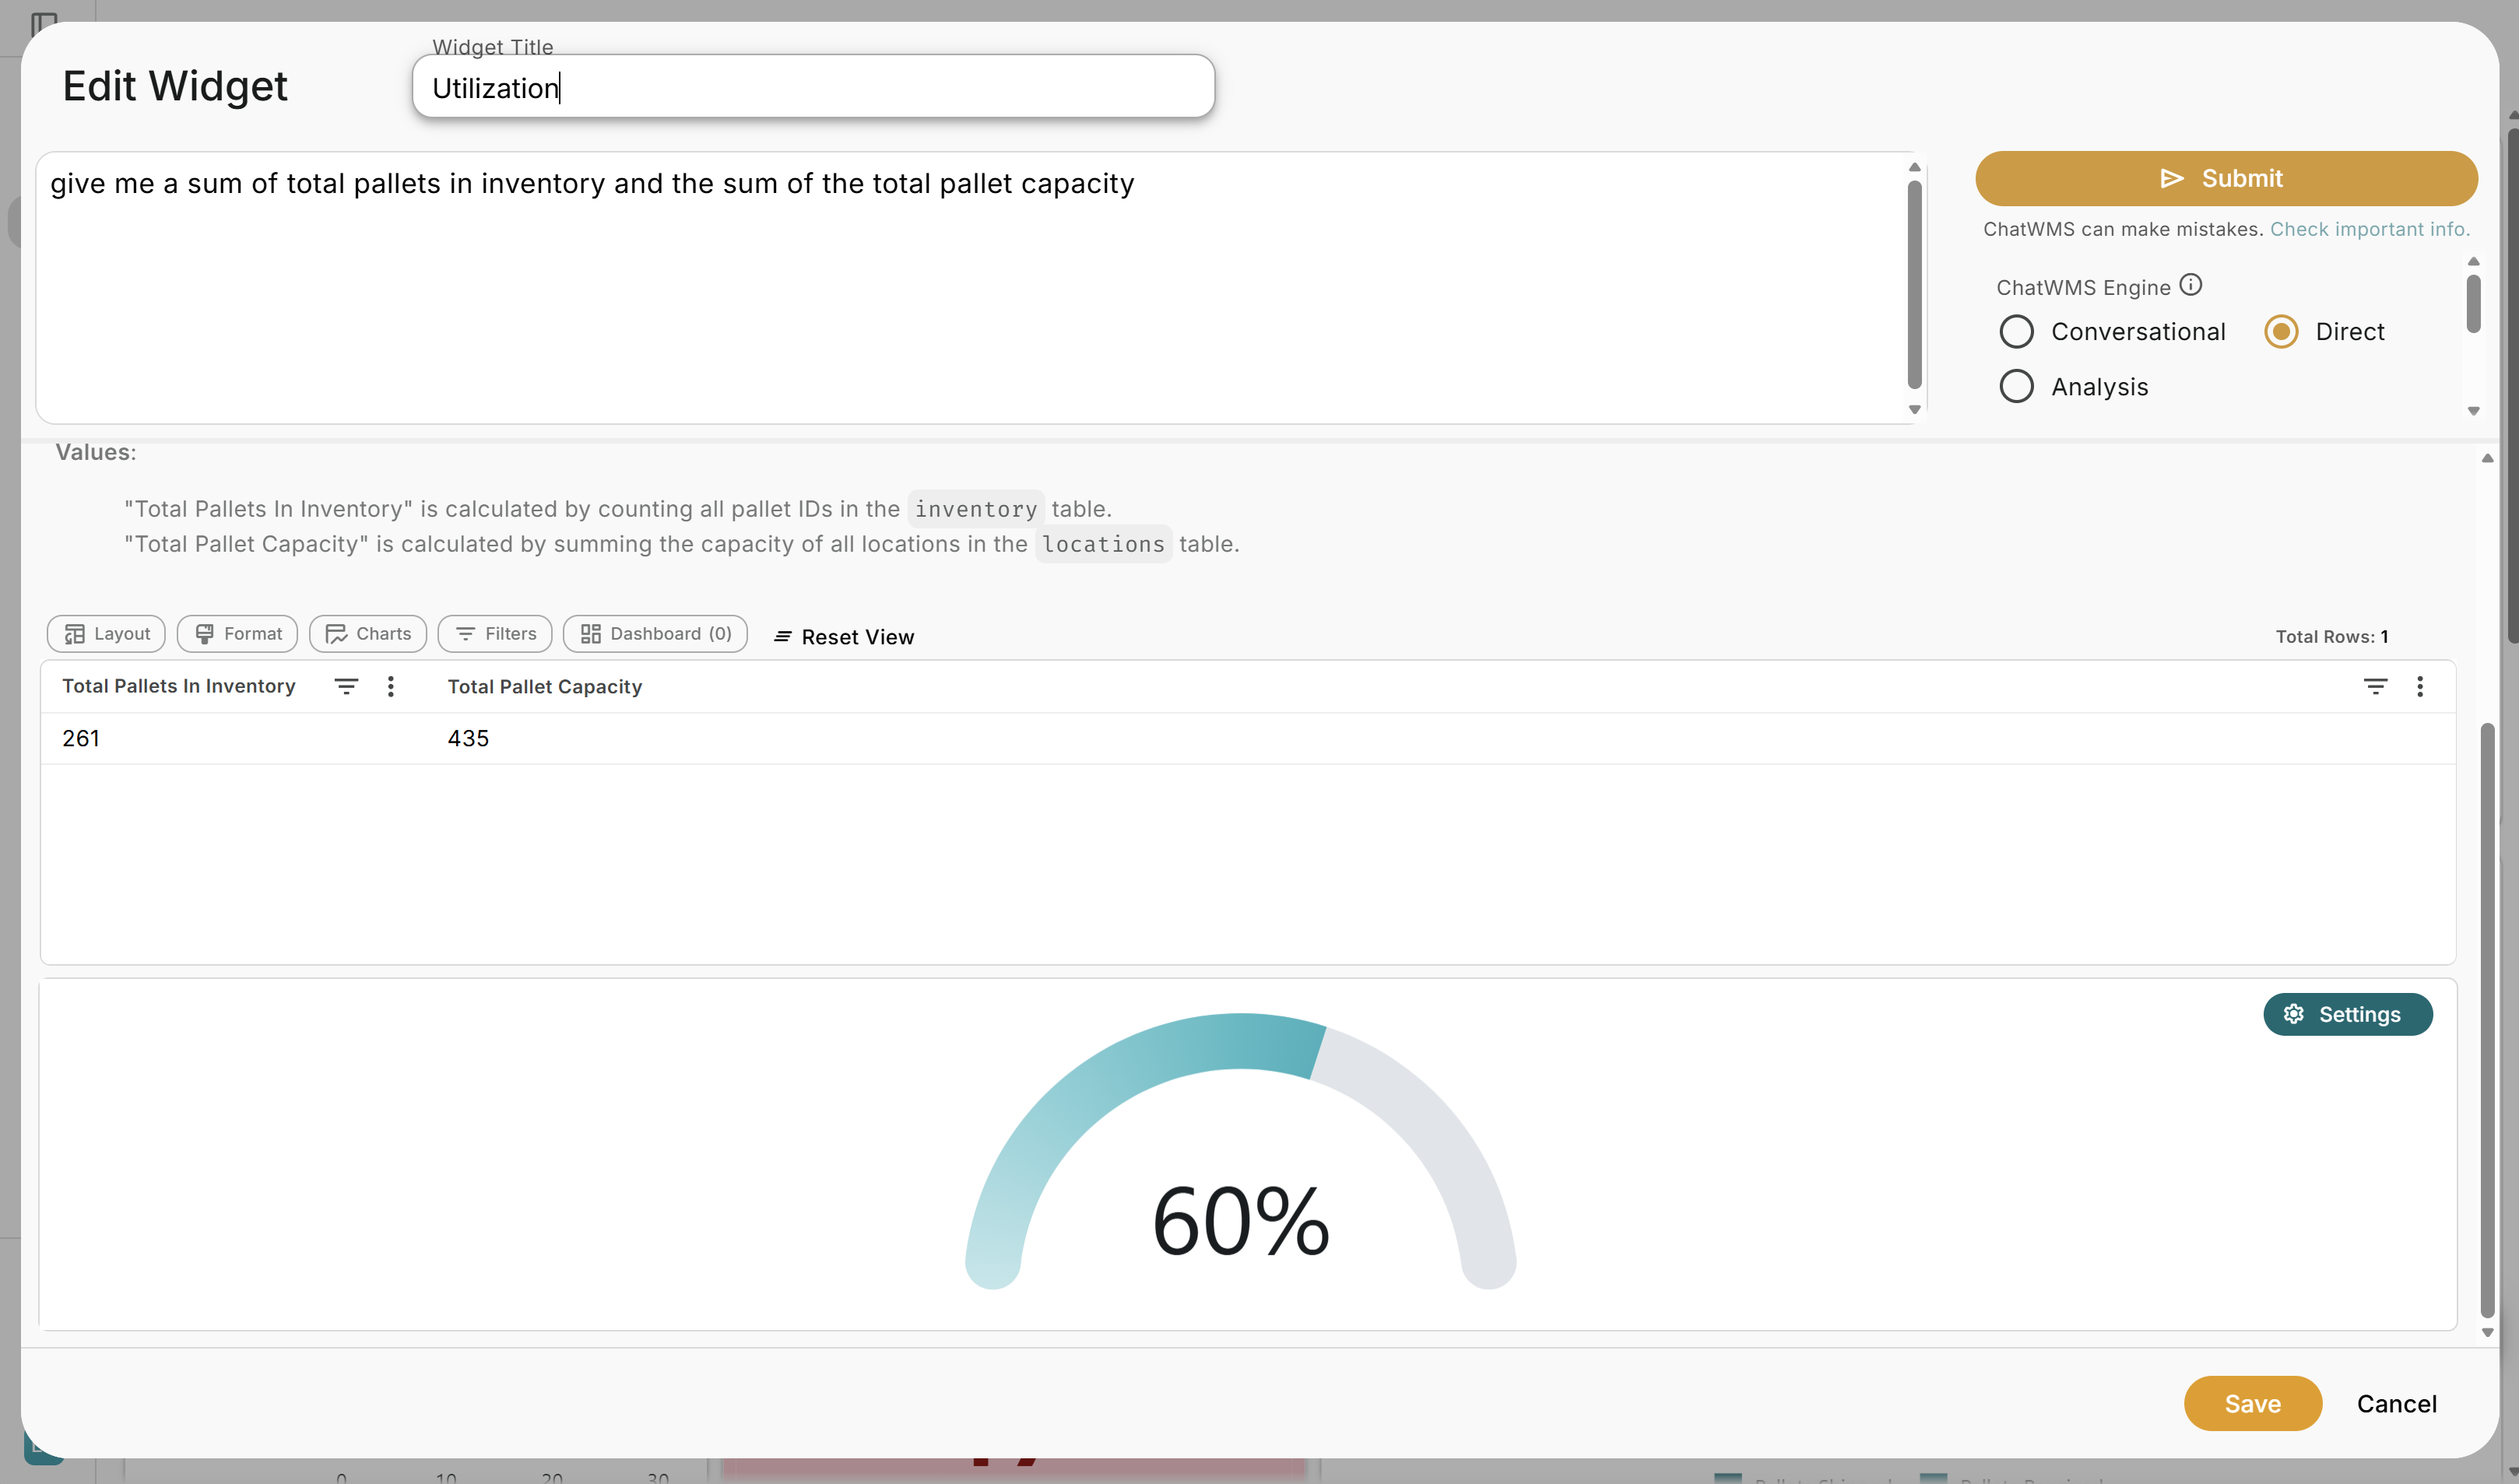
Build the view you need  

Turn results into simple operational visualizations.
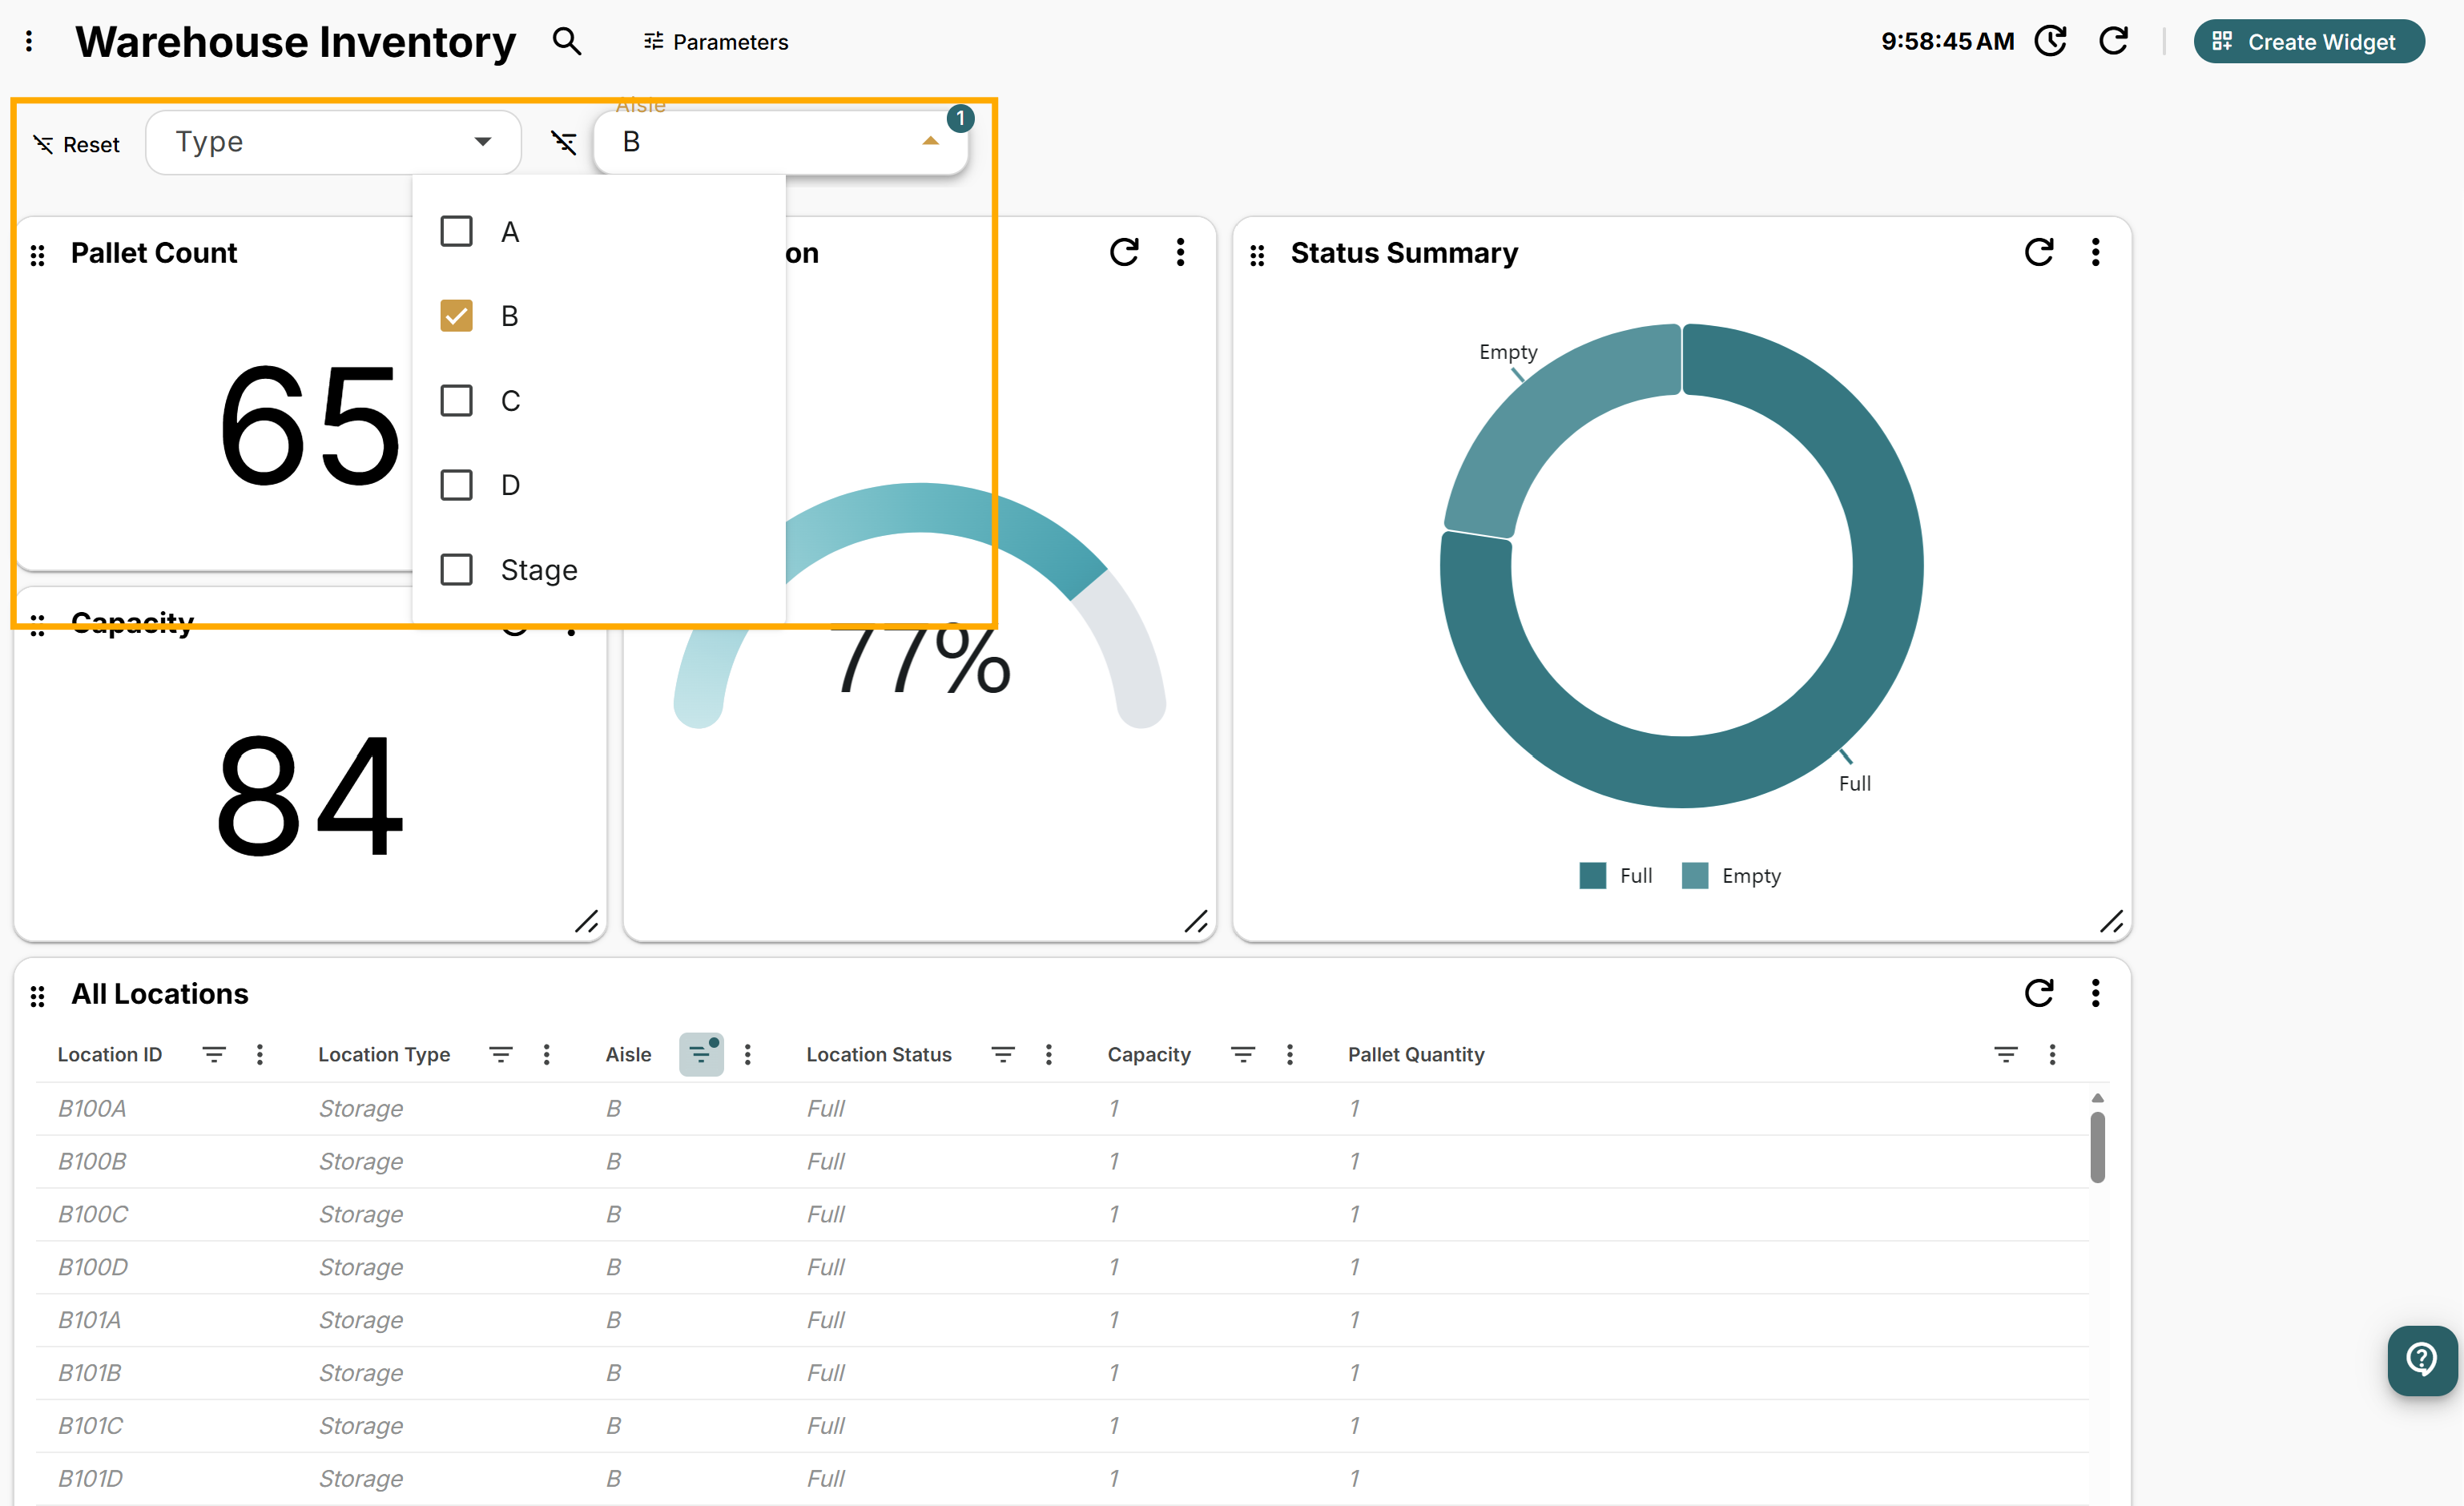
Screenshot 2026-09-11 095935

Filter to what matters 

Narrow dashboards by area, work type, date, and more.
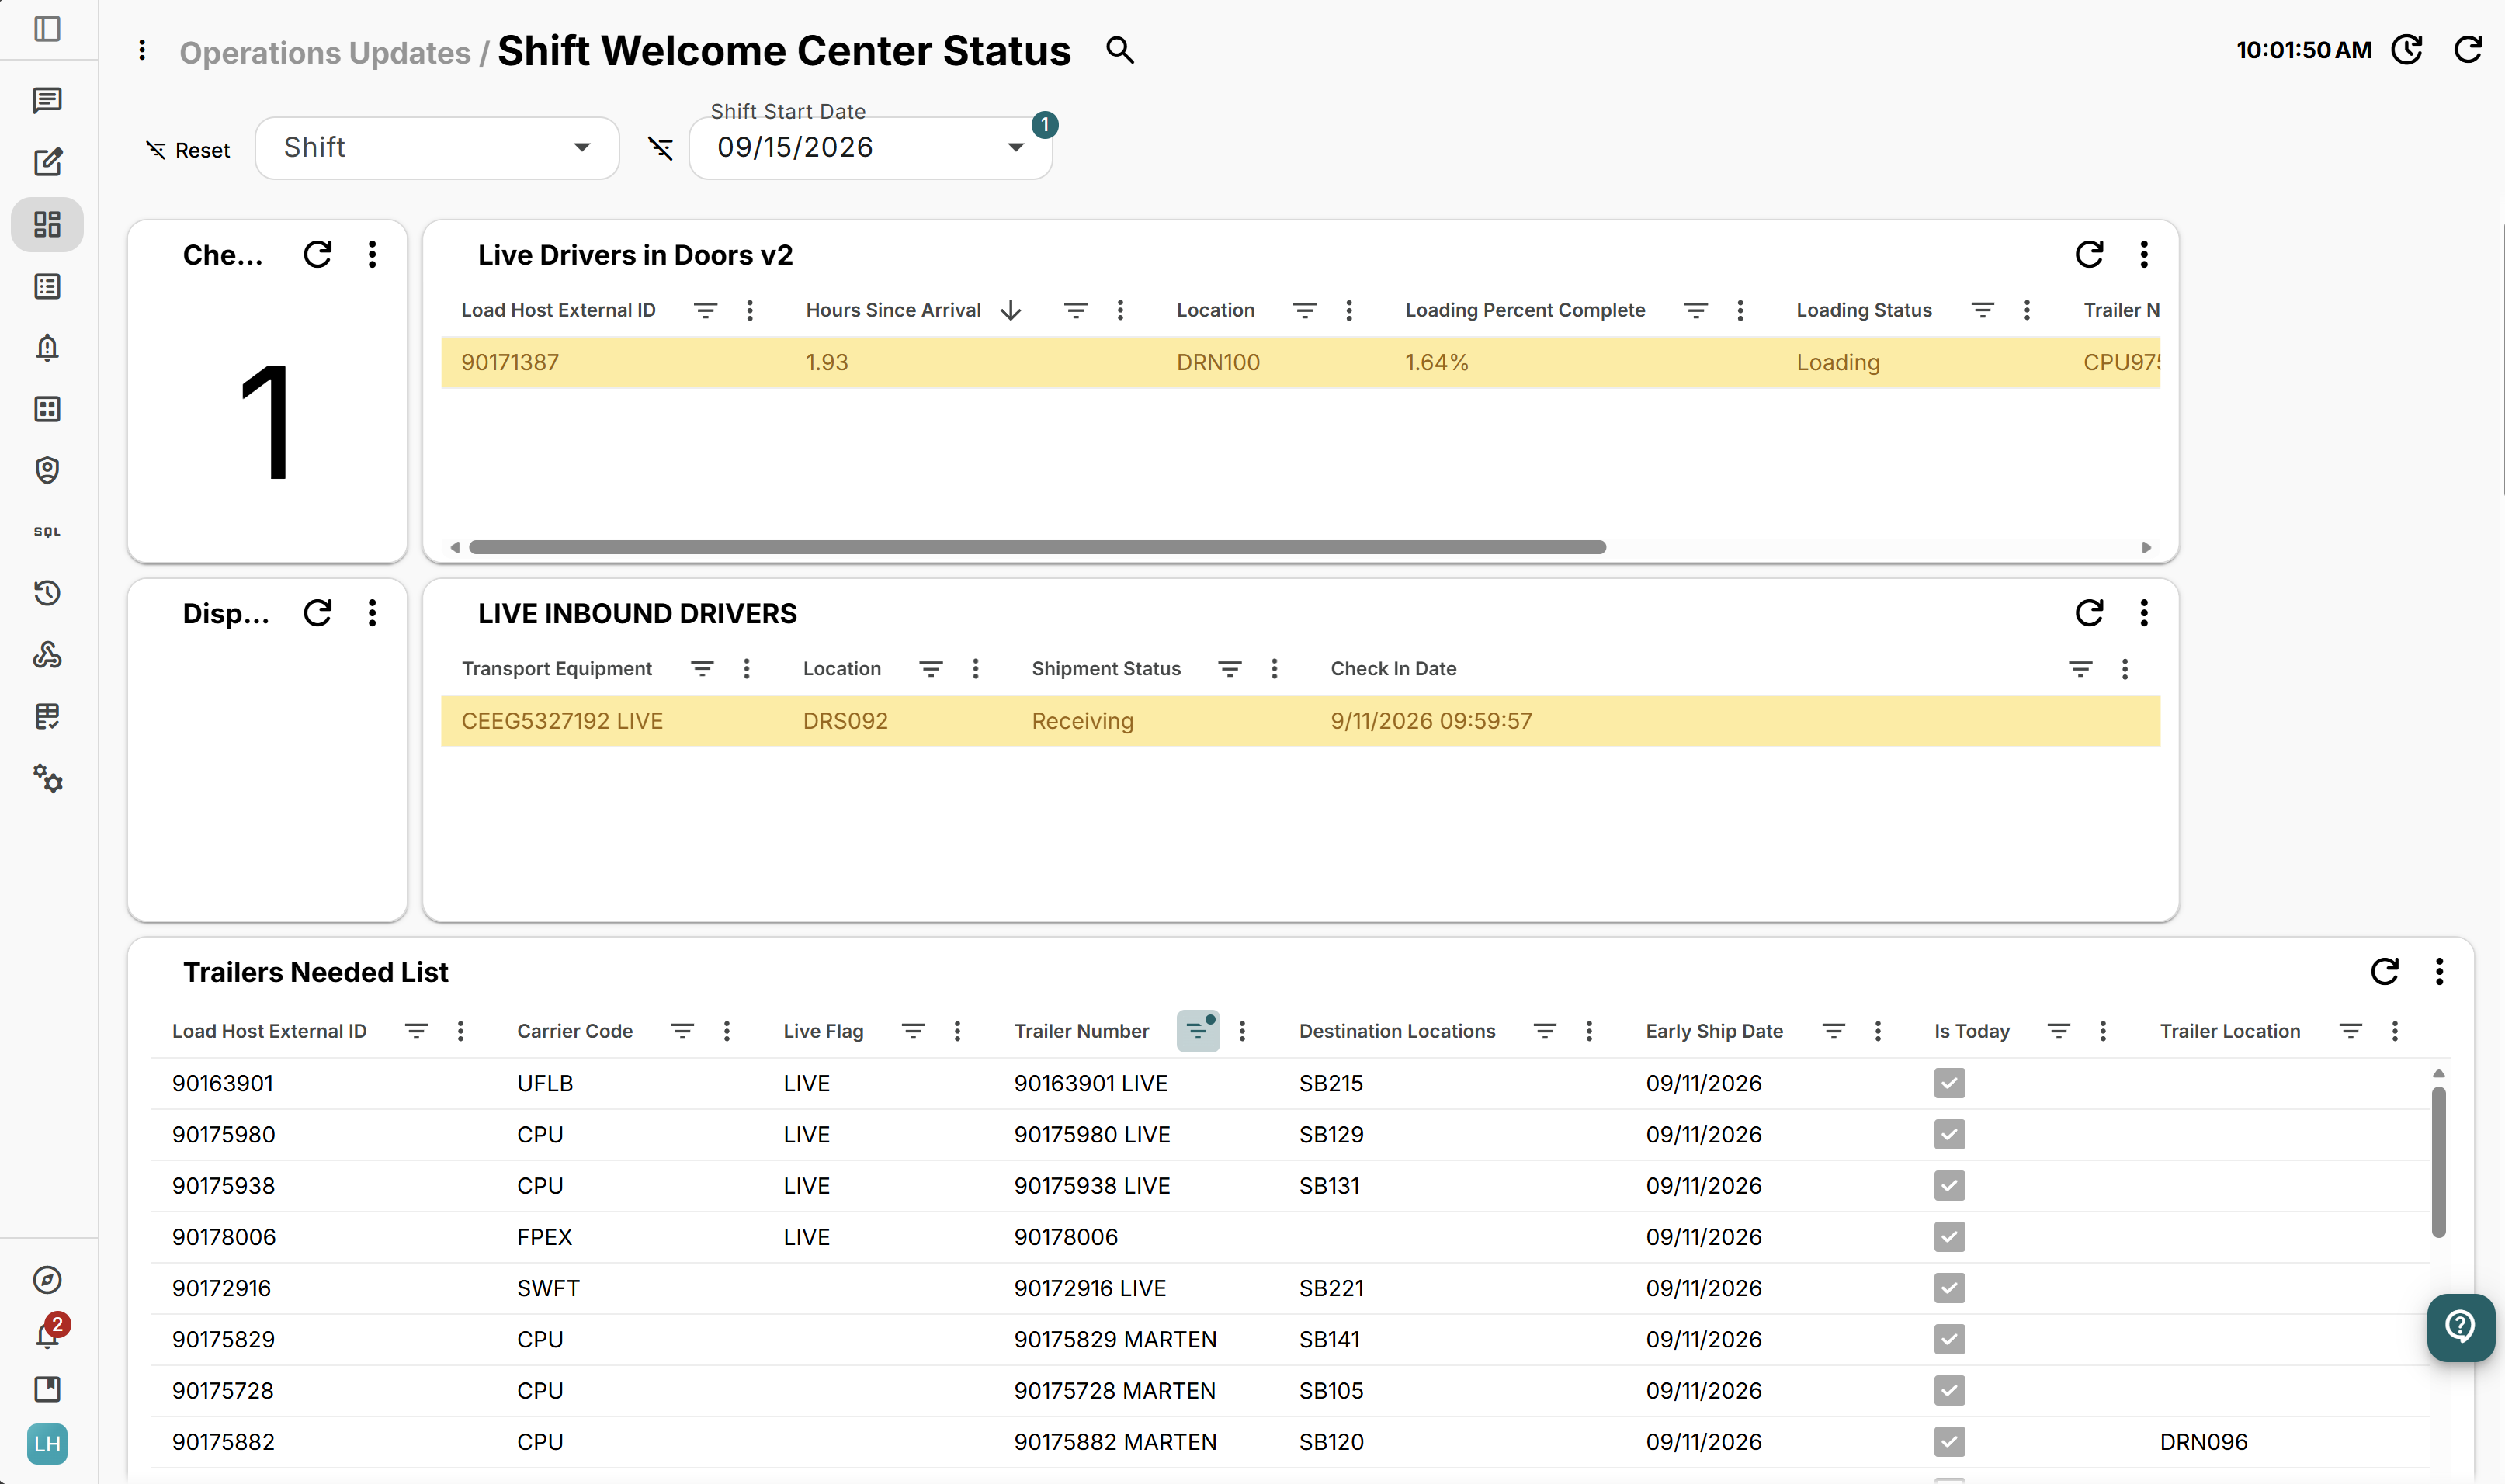
Screenshot 2026-09-11 100206

Bring multiple metrics together 

See multiple operational measures in one place.
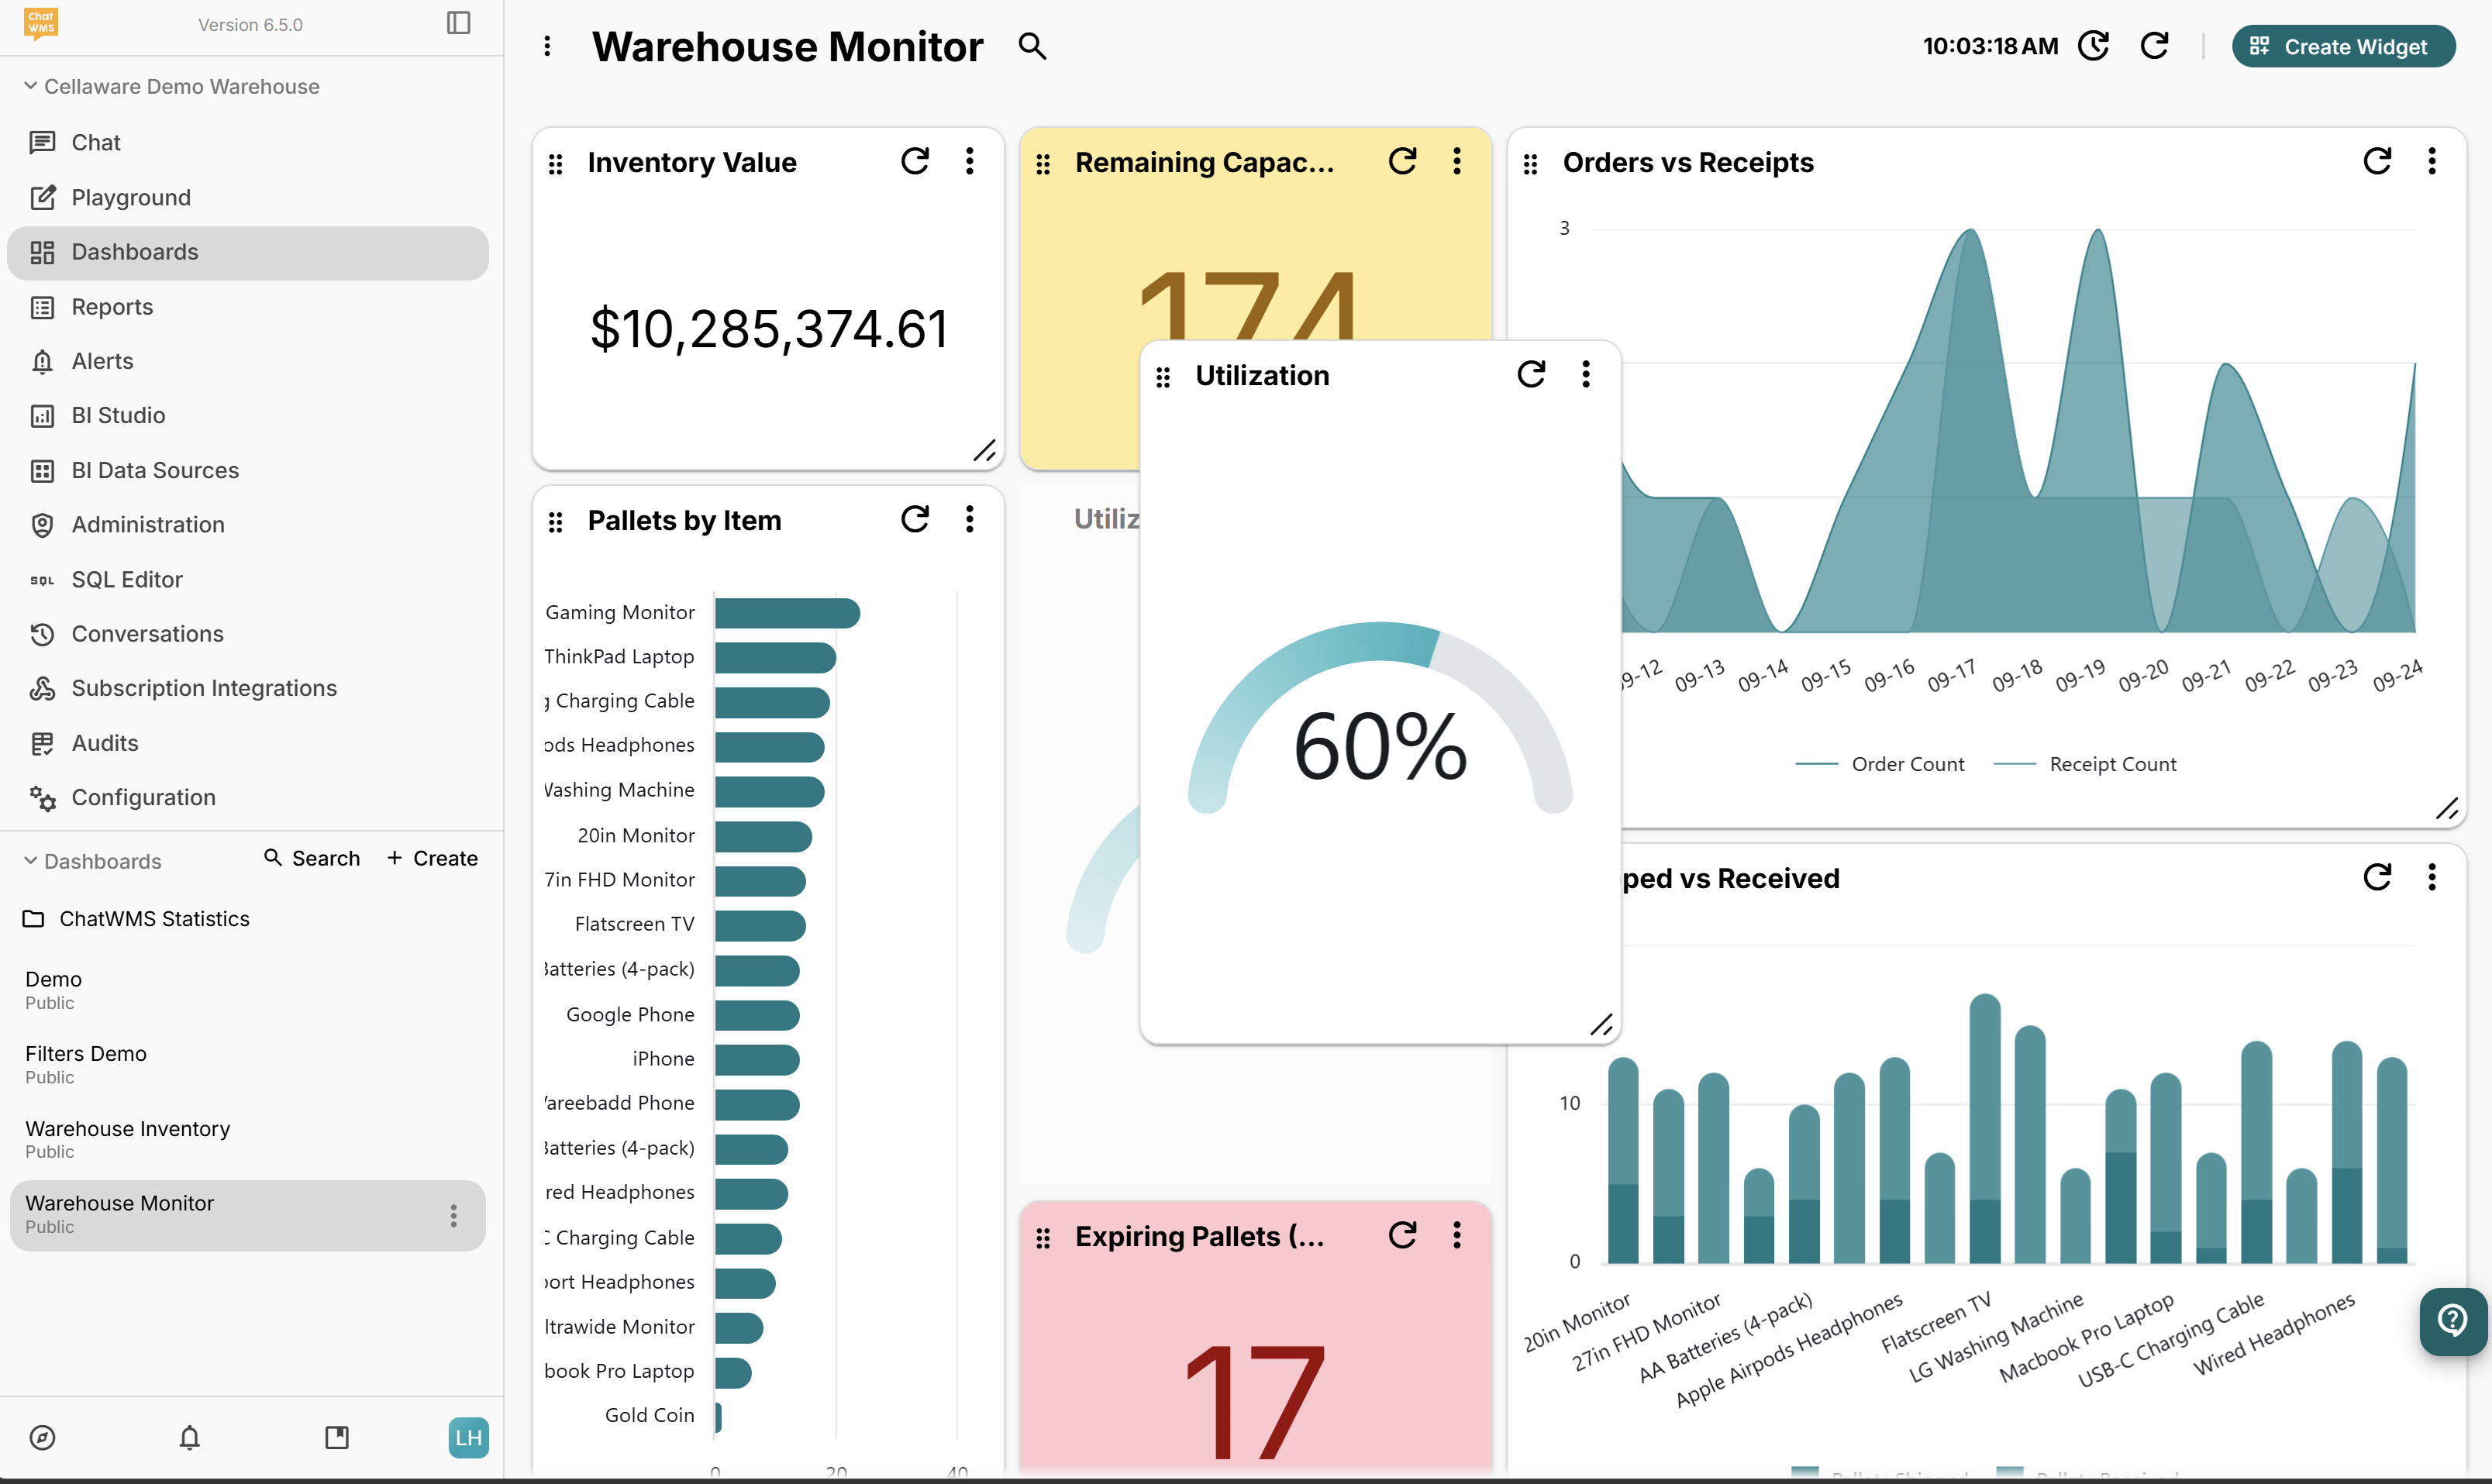
Screenshot 2026-09-11 100345

Keep dashboards relevant 

Update views as priorities change.

Real Views From the Warehouse

Ask the questions your team already has. ChatWMS handles the data behind them. 

  • Outbound Performance

  • Receiving Activity

  • Inventory & Capacity

  • Labor & Productivity

Screenshot 2026-09-11 100958

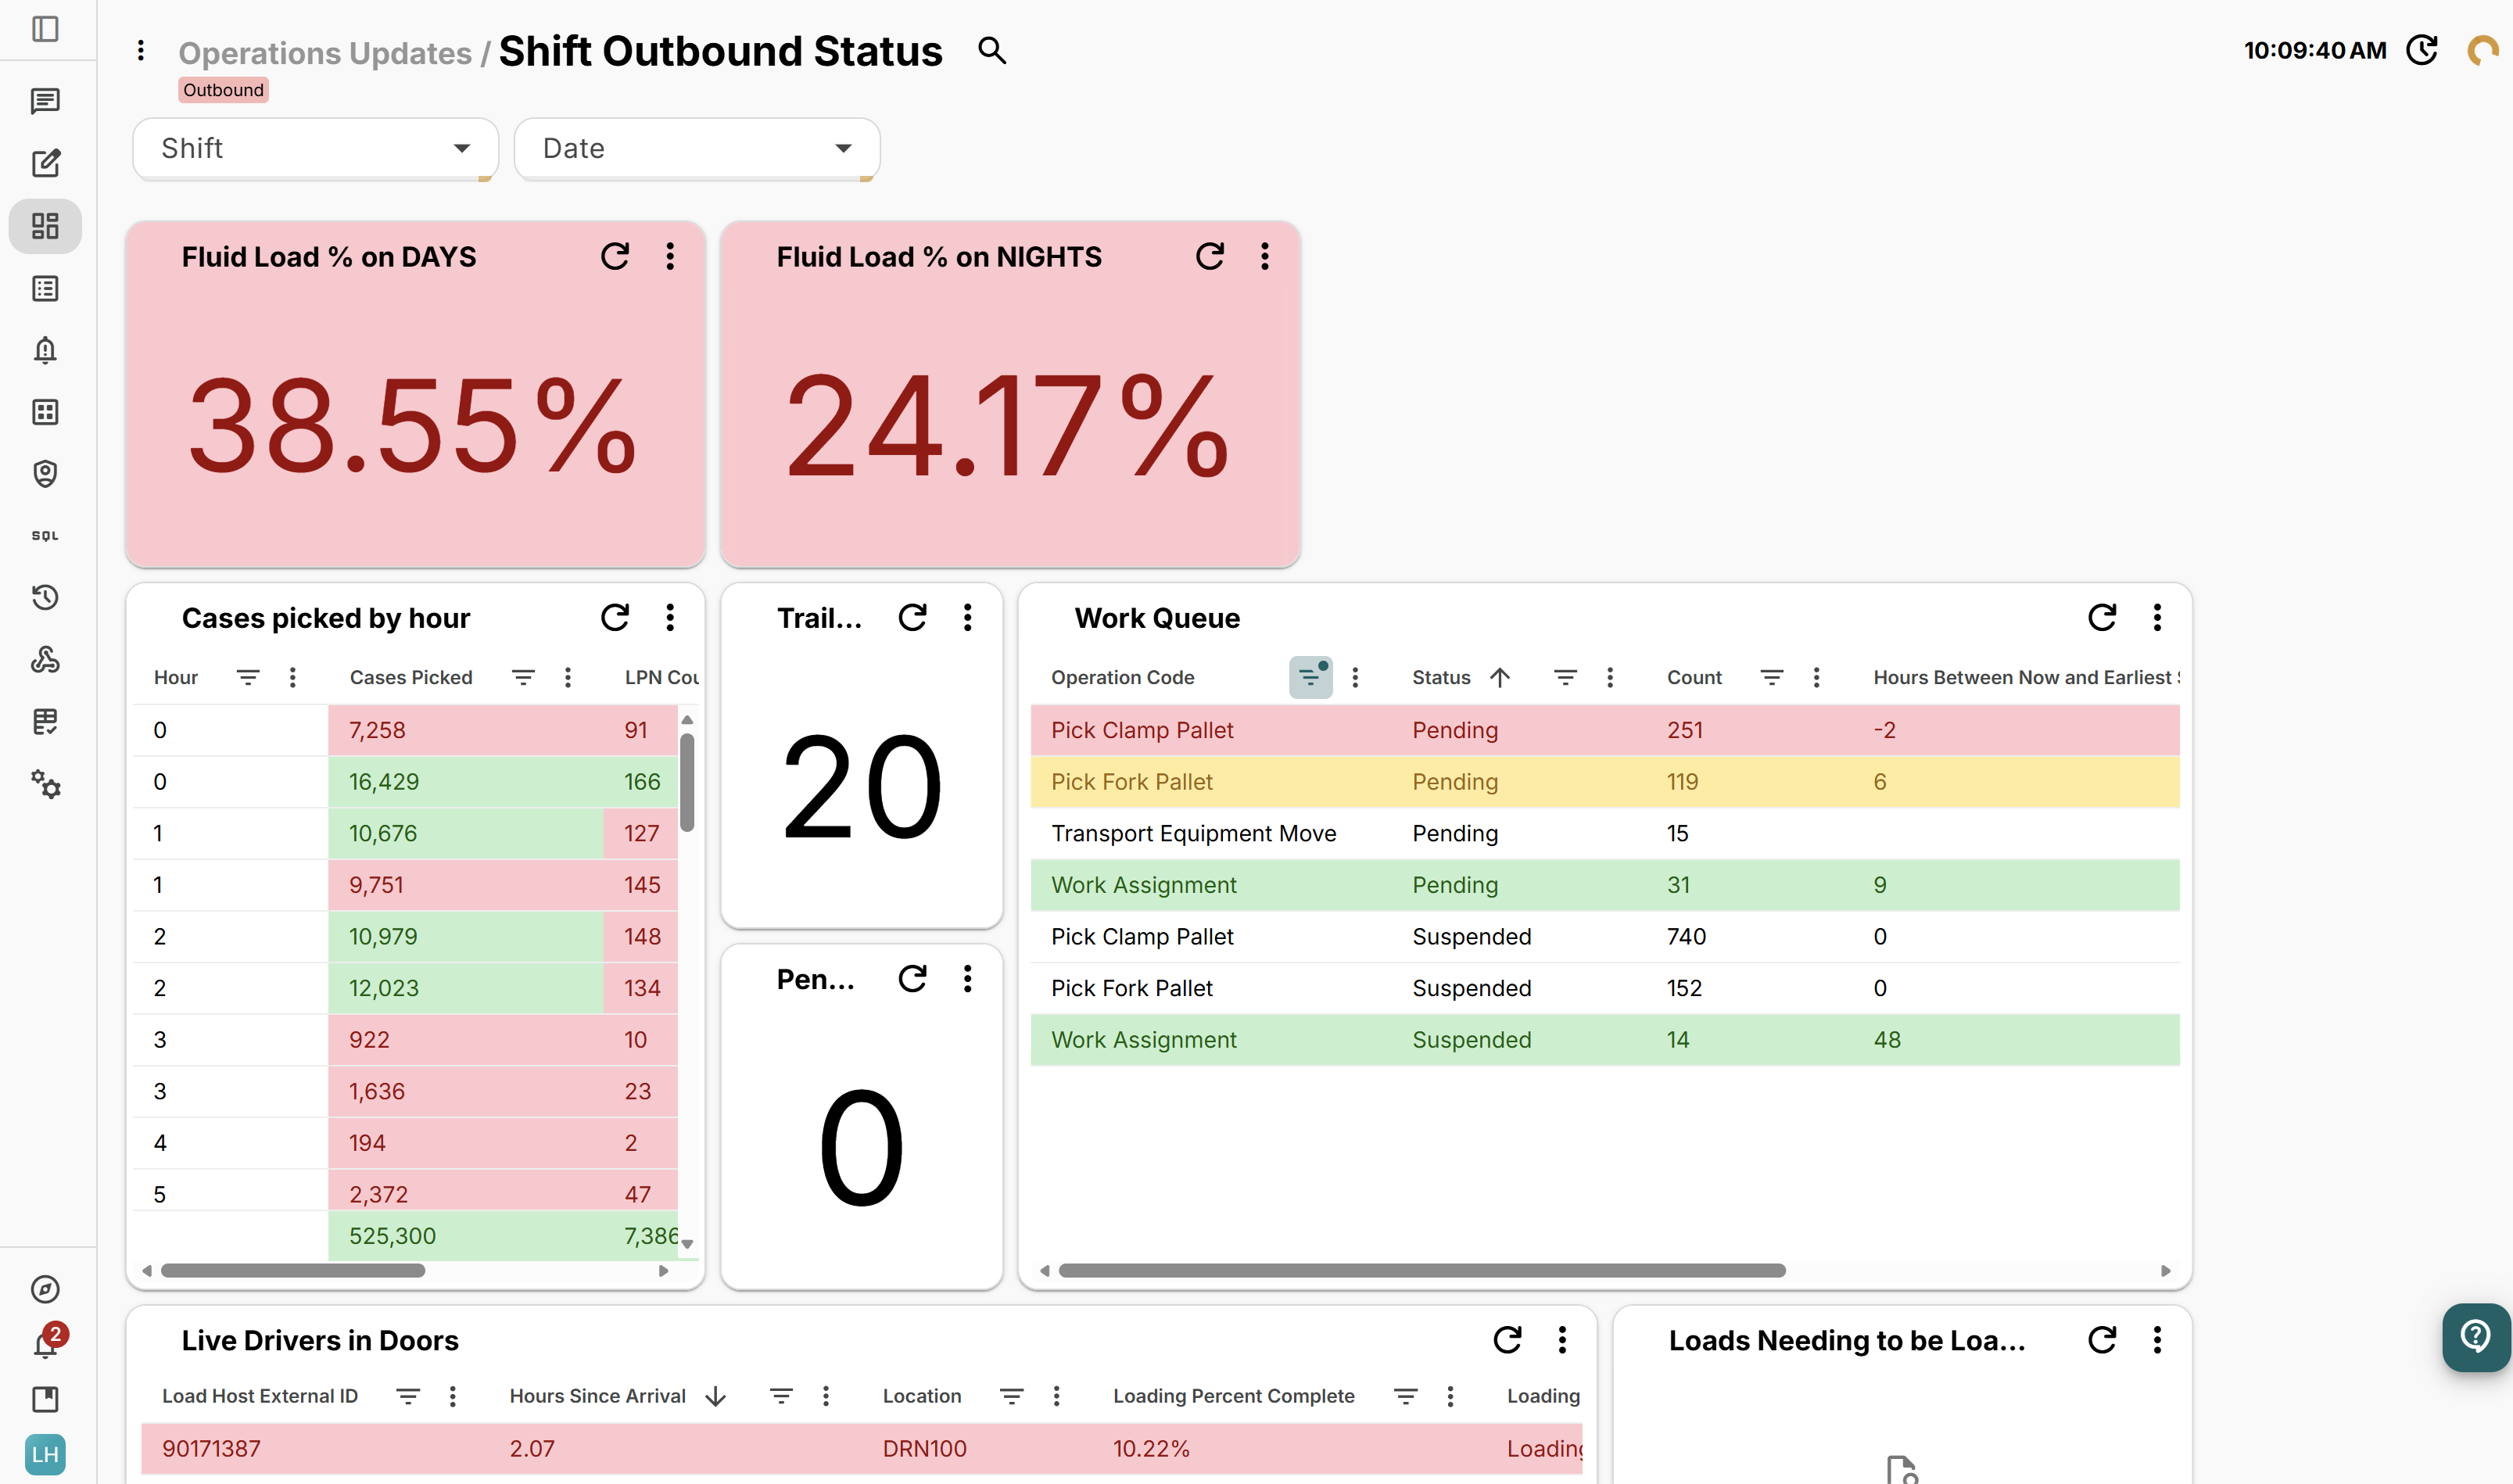
See what still needs to move.

Bring open orders, remaining picks, shipment activity, and backlog into one view so supervisors can quickly identify where outbound work is building up.
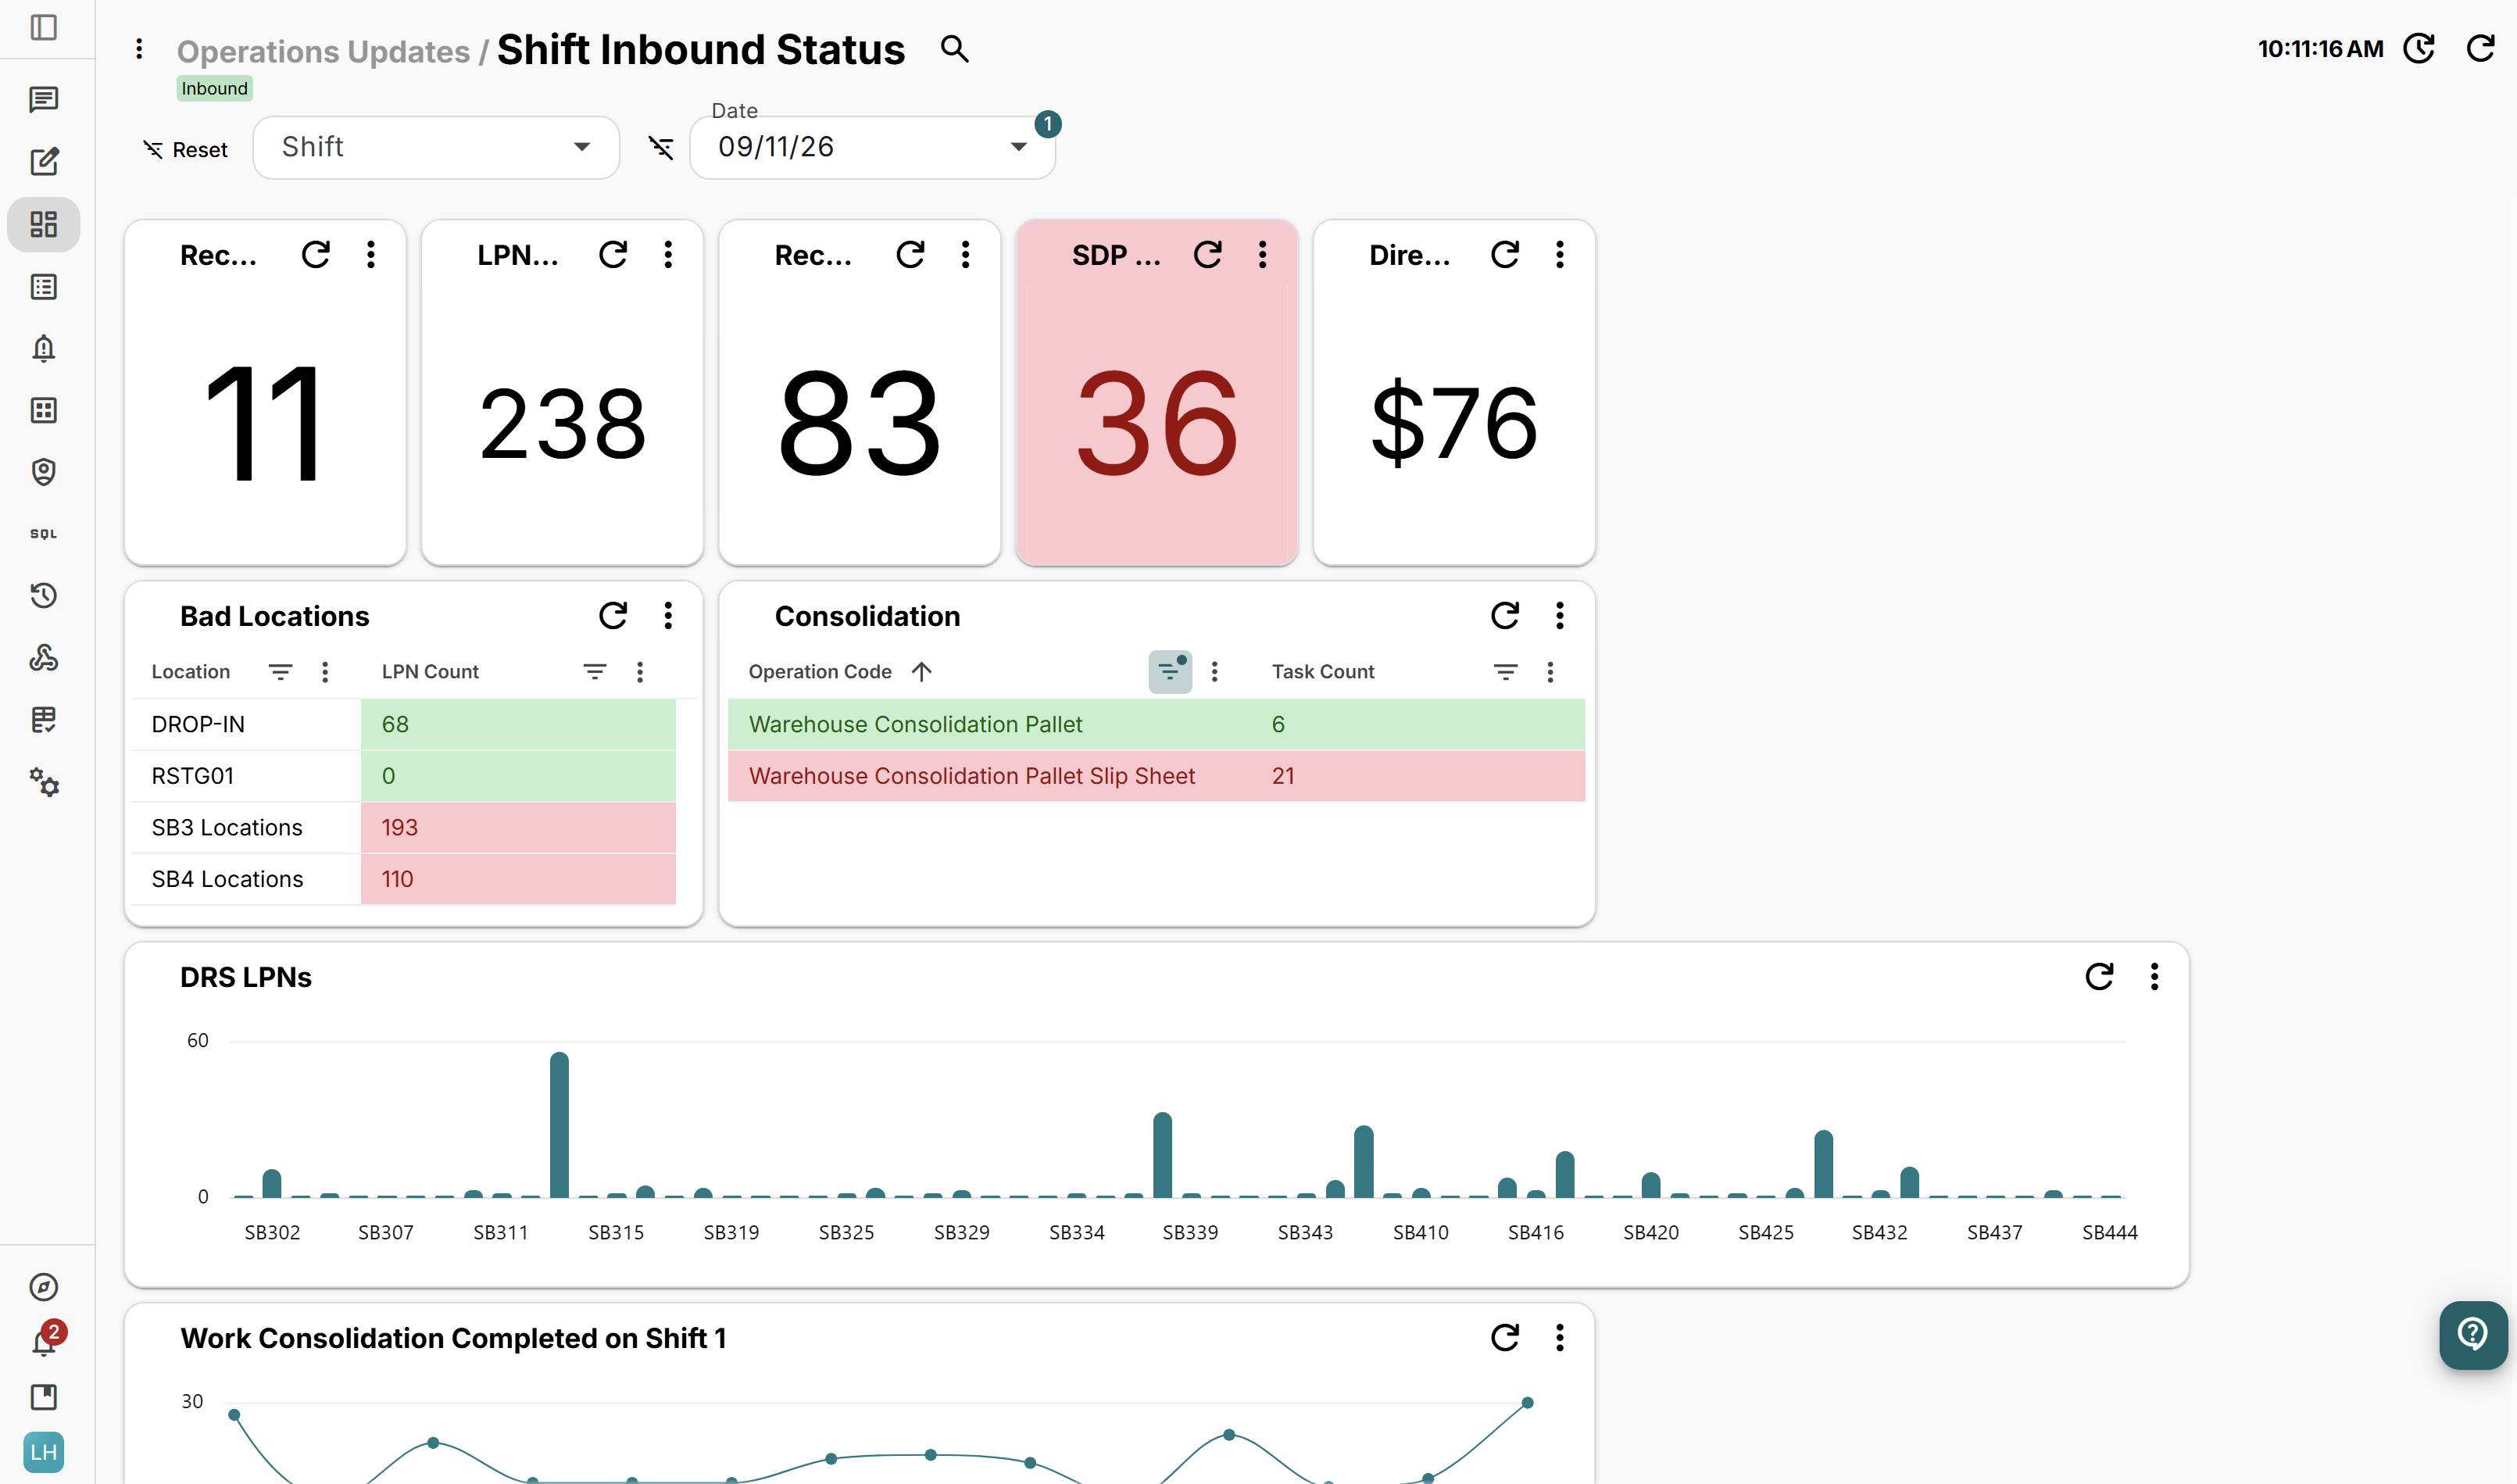
 

Screenshot 2026-09-11 101143

Keep inbound workload in view.

Monitor receipts, units received, inbound volume, and activity over time so teams can understand workload and respond as conditions change.
 

Screenshot 2026-09-11 101316

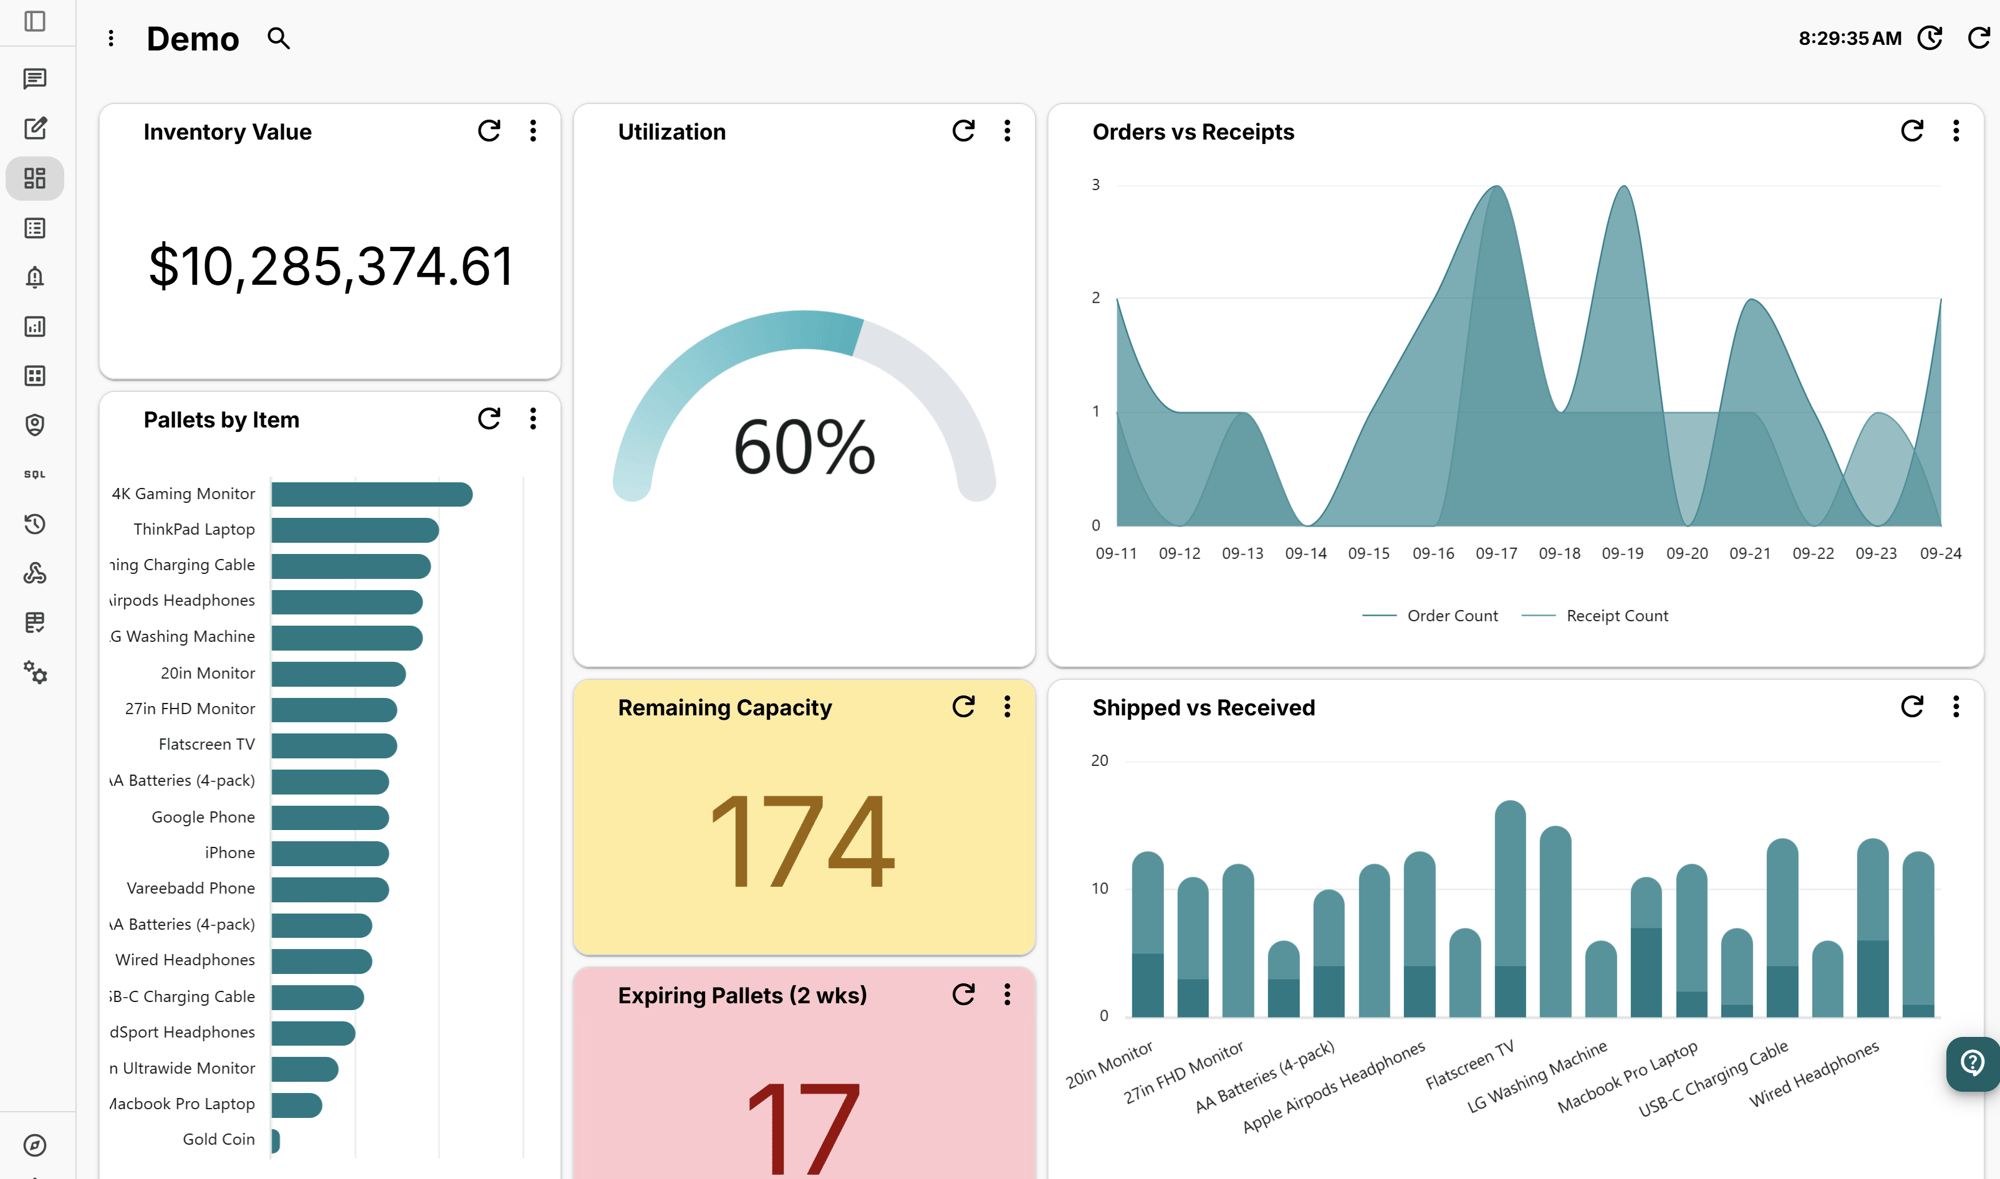
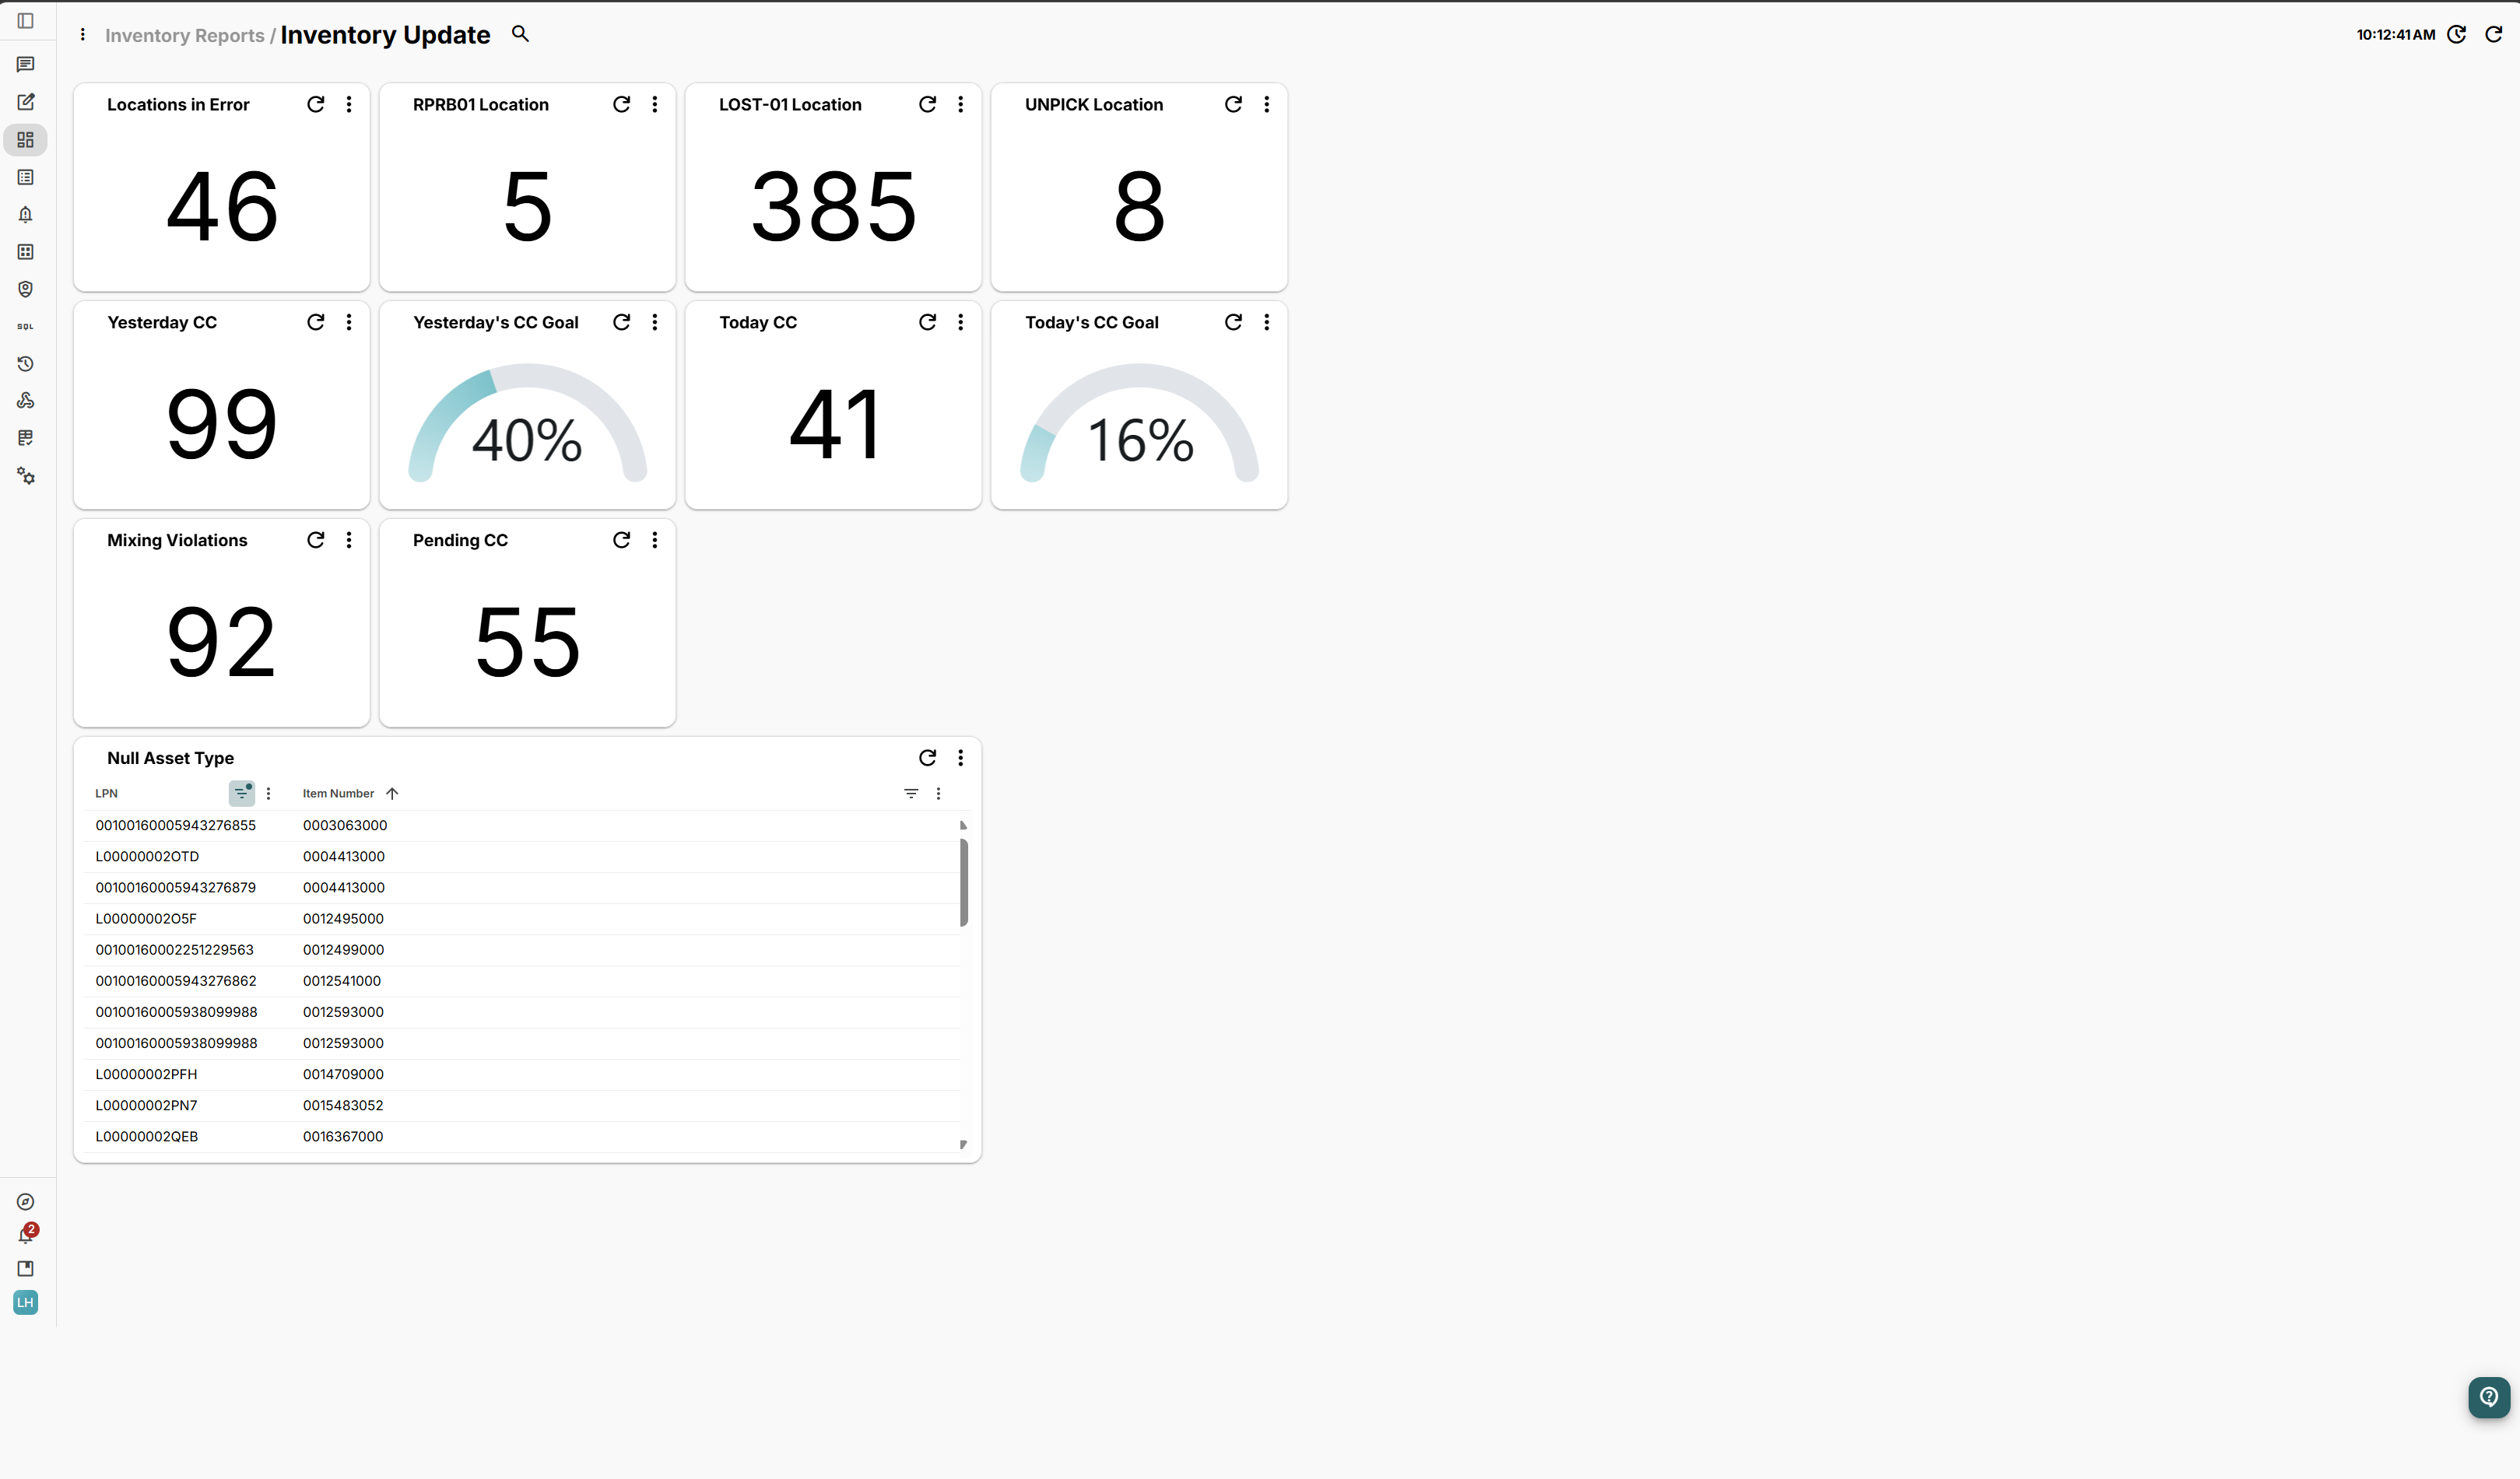
Know where you have room to operate.

Track inventory levels, utilization, empty locations, and capacity metrics together so teams can quickly understand how warehouse space is being used.
 

Screenshot 2026-09-11 101952

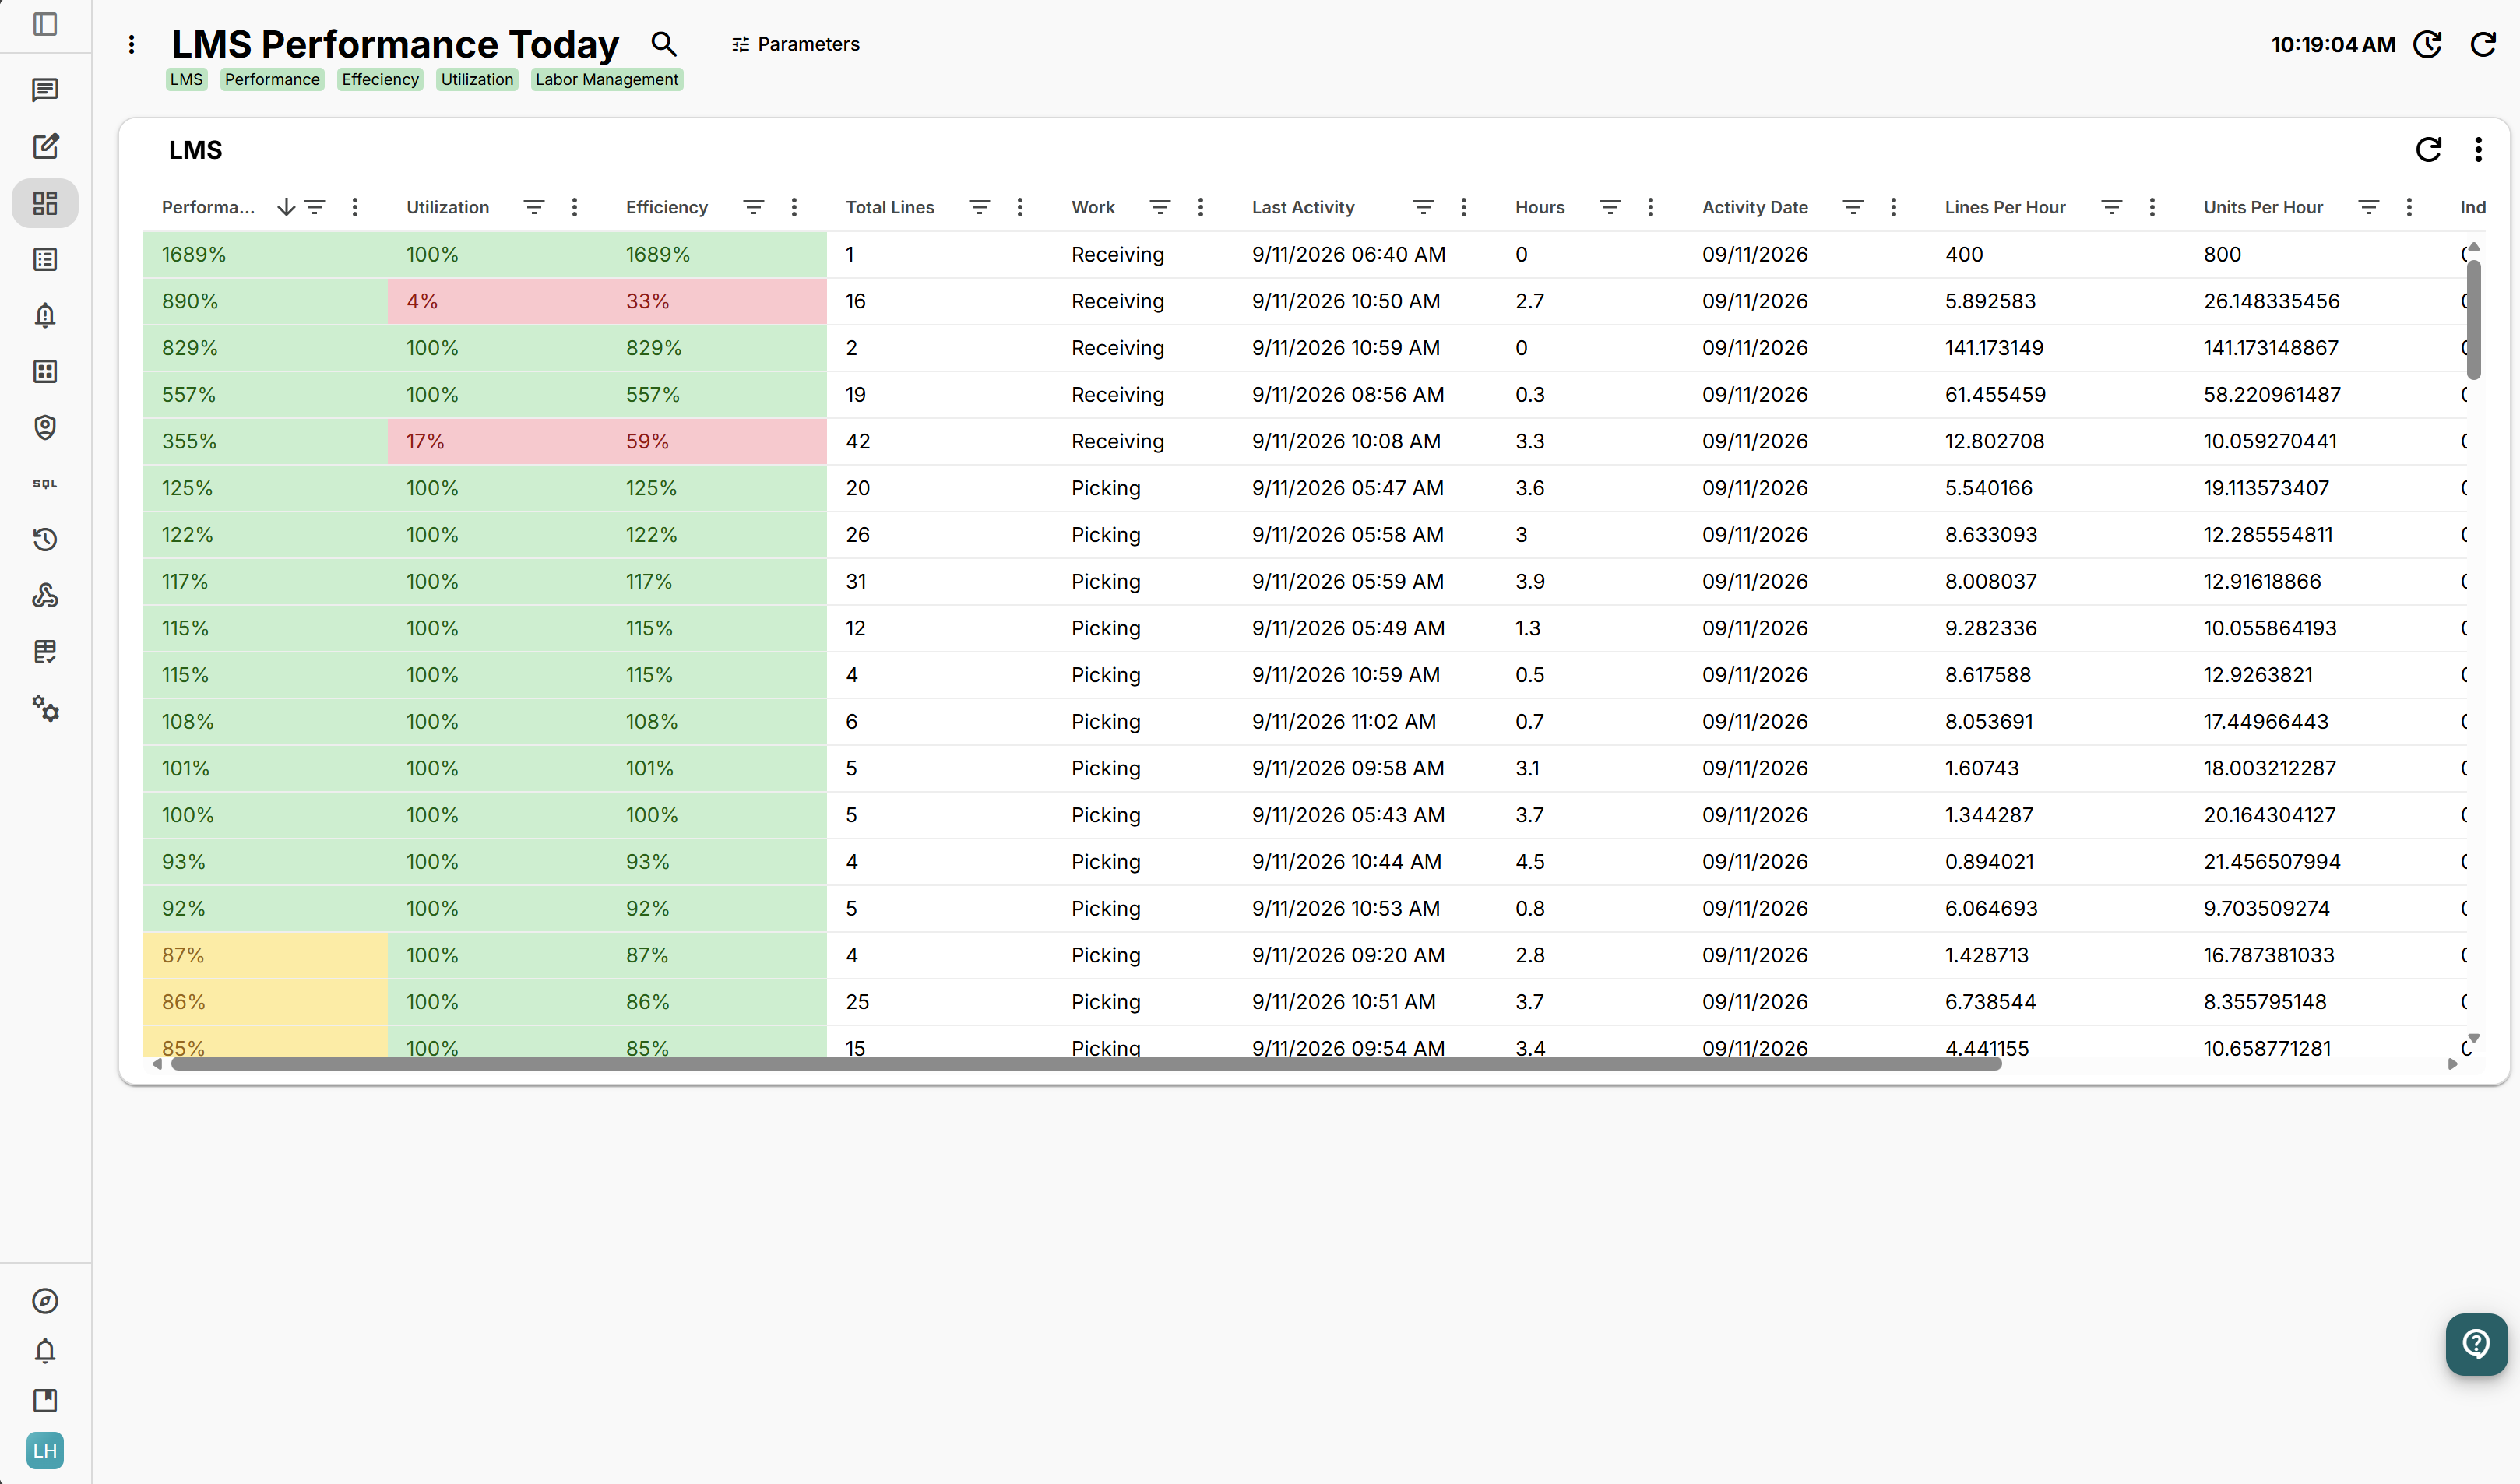
See where the time is going. 

Track work activity, productivity, and time by work type to identify where performance is changing or where additional attention may be needed.


POWERFUL FEATURES

Answers you can understand AND verify. 

See the data, logic, and detail behind every answer.

Built on your WMS Data

Dashboards reflect the warehouse data ChatWMS is connected to.

Transparent by Design

Review supporting detail and underlying SQL.

Read-Only Access

Query operational data without writing back to the WMS.

Human Oversight

Quality review helps improve accuracy over time.

ISO 27001 Certified | No Raw WMS Data Storage | 90-Day-or-Less Retention | AI ZDR / No Model Training

Dashboards keep the operation visible.

 Go beyond the view. 

Turn what you monitor into alerts, reports, and deeper analysis.


See what your warehouse data can show you.